Dashboard Design

Time

6 weeks

Tools

Figma, Adobe XD, Illustrator

Skills

User Research, Wireframing, Prototyping

Design Process

Problem & Solution

Problem

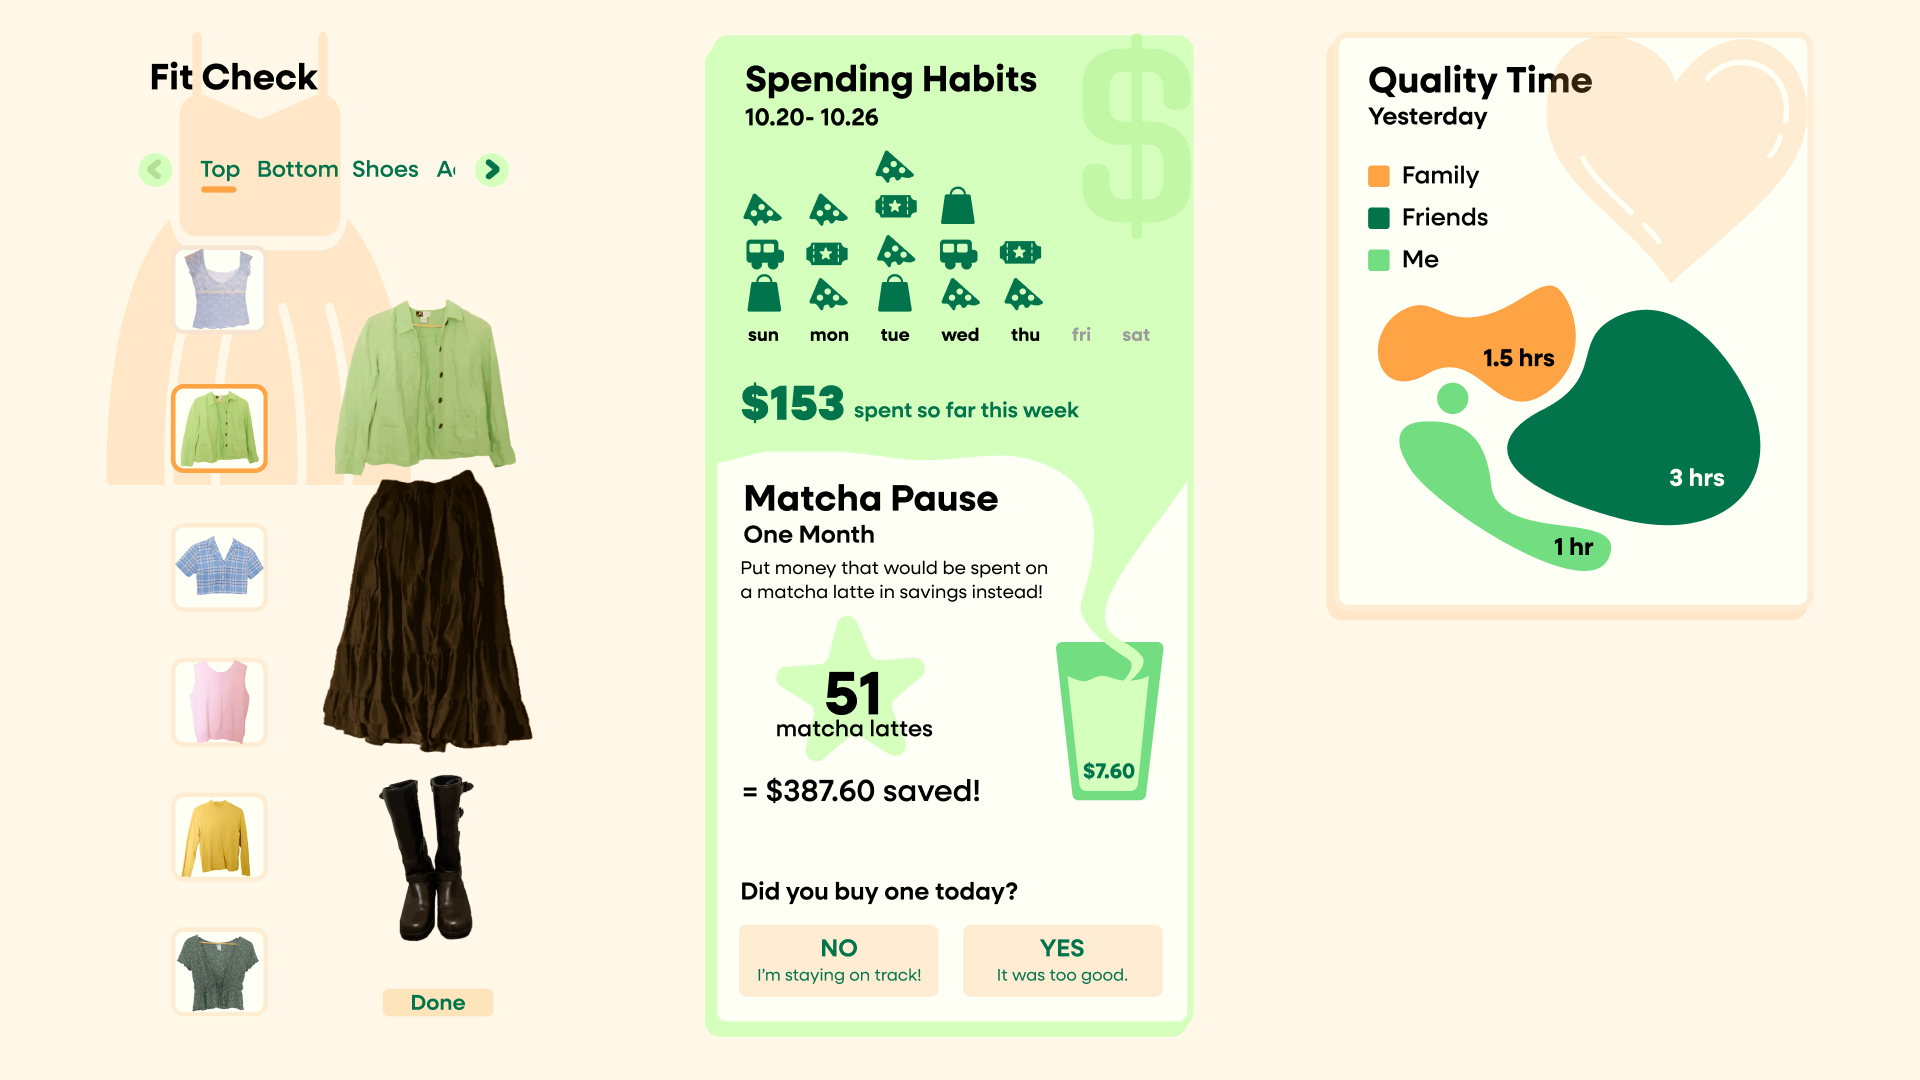
Take something subjective such as personality and communicate it through stylistic and layout choices.

Solution

Simplify the statistics and reveal information through interactions to minimize clutter. Use the grid to structure the widgets but use shapes and color to make it feel organic.

Research Findings

User Persona

I challenged myself to design my own personal dashboard. I focused on making an approachable and intuitive layout for users my age while navigating my personal taste and style.

About me

I love bright and colorful aesthetics. I'm a college student who wants to budget better and make my matcha and coffee from home. I also love documenting my days through my camera while wearing stylish outfits!

User Journey Map

Wireframe

After gathering feedback on initial concepts, we moved on to creating wireframes and low-fidelity prototypes to test usability before building the high-fidelity designs.

Wireframe Sketches

Iterations

We conducted user research and competitive analysis to ensure our design aligned with user needs and industry standards.

Research Findings

Lessons Learned

After gathering feedback on initial concepts, we moved on to creating wireframes and low-fidelity prototypes to test usability before building the high-fidelity designs.

Wireframe Sketches

Other Projects

Zoo-ly App Design
Product Design, UI Design, UX Design
Tamagotchi Design
Interactive Design, 3D Design, Product Design